Visualizing human development
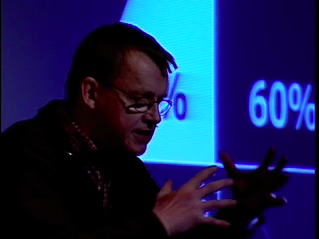
At TED 2006, Hans Rosling presented some cool data visualizations created to shed light on trends in Human Development (specifically health and economic prosperity).
He and his nonprofit Gapminder have done some cool things with visualization to bring out aspects of the data that get ignored, but as he notes, we haven't got the holy grail yet. Looking through the Gapminder site, it looks like all the visualizations are hardwired to a specific dataset. This pairing of presentation to specific data provides punch to items like their Dollar Street 2003 Shockwave presentation, which includes home walkthrus comparing lifestyle across the world's economic ranges. (Very cool.) But it leaves me on my own if I want to apply the kind of graphing methods he presents to a dataset that Gapminder isn't taking on.
It seems to me the next natural step with more general visualization tools like those in Rosling's TED presentation (even more than searchability) is to develop a visualization system that lets analysts and decision makers apply the same sort of visualizations over their own data, or better, over multiple datasets from multiple sources, providing the same plotting, subset exploding, curve overlays, and multi-axis visualization. Move from delivering the individual visualizations to providing the tools to create the visualizations.
Some very cool stuff they've done already though. Shows the power of visuals to convey a message.